


CT’s Favourite Question
The phrases “it’s so over” and “we’re so back” date back to Twitter posts from 2021. They developed into the four-stage Wojak cycle that crypto twitter now runs on autopilot: rage, depression, cautious hope, euphoric delusion. At some point, it ceased to be a joke about mood swings and evolved into the unofficial sentiment index for crypto as a whole, which is updated whenever a few green candles appear following a difficult period.
An unauthorised sentiment index’s weakness is that no one is really able to verify it. This week seemed to be the perfect time for CT to pose the topic once more, therefore it seemed worth actually answering it with numbers instead of vibes.
Why The Question Is Back
On June 6, Bitcoin hit a twelve-month low of $60,816. Since then, it has risen to almost $64,500. That is a significant increase, around six percent from the low, and it is taking place as Strategy is building up and maintaining a Bitcoin reserve that is estimated to be close to $3 billion, creating what is essentially an institutional demand floor beneath the price.
It is also still on the rise while sitting roughly 49 percent below Bitcoin's all-time high of $126,000 from back in October 2025. This is precisely the type of split screen that causes "are we back" to trend: a six percent bounce and a forty-nine percent drop on the same chart at the same time.
What The Data Is Pointing To
Sentiment is fluctuating, not recovering: On July 9, the Crypto Fear and Greed Index recorded Extreme Fear at 22. During July 14 to July 22, it briefly reached Neutral in the mid-40s to low-50s. However, by July 25, it had returned to Fear at 26. That is indecision bouncing off both walls of the same room, not a clear ascent out of fear.
Bitcoin dominance has not waivered: Dominance is currently at 56%, practically constant during the rebound. A true "we're back" moment has historically been characterized by declining dominance and capital shifting from Bitcoin to alternatives due to a genuine recovery of risk appetite. The rotation has not yet begun.
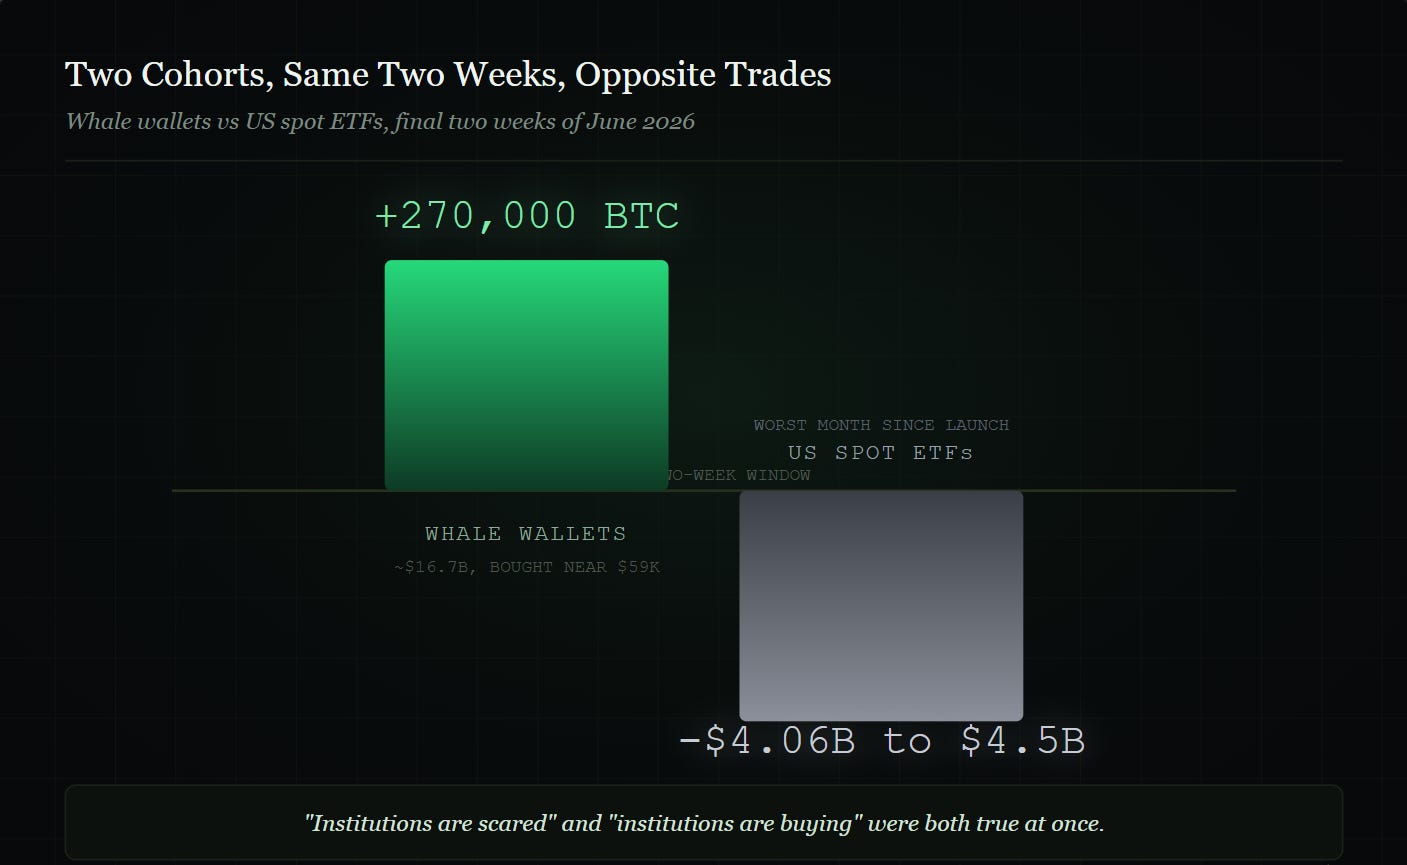
ETFs just had their worst month ever: For the first time since the products' introduction in January 2024, US spot Bitcoin ETFs reported net outflows of between $4.06 billion and $4.5 billion solely in the month of June. Total 2026 flows also turned net negative for the first time in the ETFs' history. This came after a separate 13-day period of withdrawals in the middle of May that had already depleted $4.37 billion. Institutional conviction, as determined by the vehicle designed especially for institutions, has not returned.
The Split Inside “Institutions”
This is the point at which the narrative becomes more intriguing than a straightforward retail versus institutional frame can convey. On-chain data from Glassnode and CryptoQuant revealed that during the last two weeks of June, whale wallets purchased about 270,000 BTC, or roughly $16.7 billion, with a significant concentration around the $59,000 mark, all while ETFs were losing a record amount. Wallets across every large size band, from 1 to 10 BTC up through the 1,000 to 10,000 BTC cohort, registered positive accumulation readings at the same time ETF holders were exiting in record numbers.
That is not retail buying the dip. Generally speaking, wallets with thousands of Bitcoin are not used by retail traders. ETF-wrapped money, which typically moves on macro headlines and quarterly mandates, sold strongly in June. This shows that the simplistic “institutions versus everyone else” narrative ignores a true split within smart capital itself. The same dip was aggressively purchased by whale wallets, which often move based on conviction and cost basis.
The trend has been closely compared by Bitfinex analysts to the sequences that preceded synced institutional distribution and whale absorption in 2022 and 2023. It has previously shown up before at real lows. Although there is no proof that this signal is genuine, it differs significantly from "institutions are scared," and practically no one is pointing it out when discussing this week's price movement.
Is There Dry Powder Available?
The stablecoin market contains the other undervalued data point. The Stablecoin Supply Ratio, which compares the market capitalization of Bitcoin to the total supply of stablecoins, fell below 10 earlier this year, a level not seen in more than two years. The total supply of stablecoins is currently close to record highs at $312 billion. Put simply, compared to the size of Bitcoin, stablecoins have more dollar-backed purchasing power than at nearly any other time since 2023. Every time this stat surfaces, CT reaches for that bullish signal: a coiled spring ready to purchase the next step up.
Where that supply is really going is the problem. USDC accounted for around 70% of adjusted stablecoin transaction volume in the first half of 2026, while USDT (historically the more crypto-trading-native token) accounted for only 25%, according to Visa's on-chain analytics, as reported by CoinDesk. Instead of waiting to purchase crypto on exchanges, a rising portion of stablecoin activity is moving toward compliant payment rails, B2B settlement, and yield products. Although far less than the 26 percent decline during the 2022 bear market, total supply has also decreased by a modest 3 percent since May, the biggest stablecoin contraction since 2023.
The dry powder exists. The topic of whether dry powder should be used to purchase Bitcoin or to purchase goods in a conforming wrapper is still very much up for debate, and the data does not yet provide a definitive answer.
The Memes Have Spoken
This is the area that the dominance chart completely overlooks. The macro data indicates that risk appetite has not generally returned, but retail degen behavior, which includes receipts from the last issue of this newsletter, tells a different story.
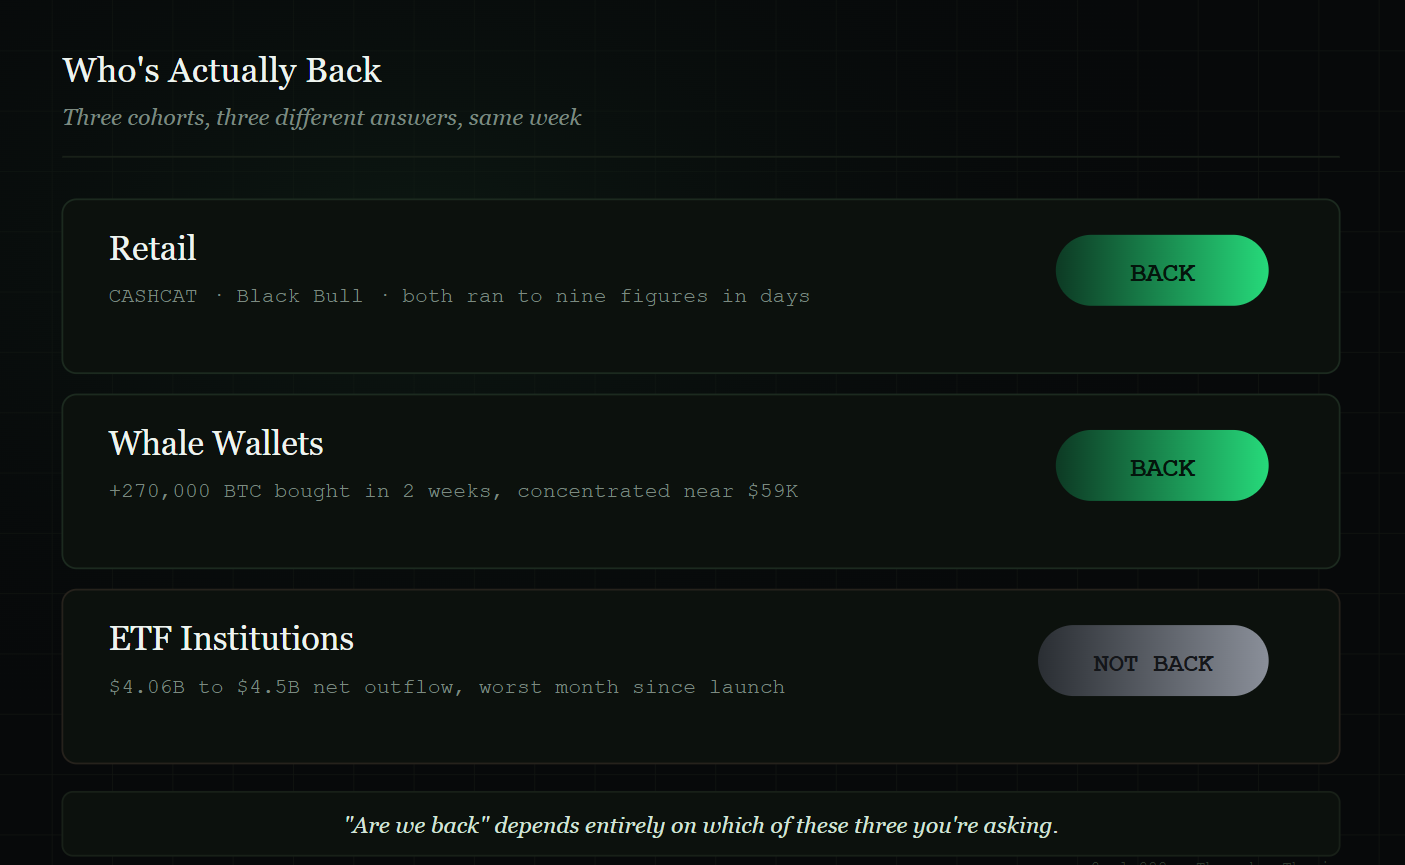
Within days of its creation, CASHCAT surged to a $150 million market capitalization on the Robinhood Chain, momentarily surpassing Hyperliquid's daily volume on a token that was a joke about a rejected company name. Black Bull, the token that was airdropped into Ansem’s wallet without his knowledge, increased by around 26,000 percent in a single week to reach a high market cap of more than $100 million during the same time frame. Because dominance evaluates the distribution of capital across key assets rather than whether a new wave of wallets is copying week-old memecoins on a chain that did not exist two months ago, neither of those changes appear anywhere on a Bitcoin dominance chart.
Beneath the meme lies the more accurate response. In the areas of the market that move the fastest and demand the least conviction, retail degen risk appetite has already returned, loudly. Perhaps it never left to begin with and was just waiting for the right narratives and stories to come into fruition. On the other hand, the dominance chart, the ETF outflows, and the fear index all concur that institutional and macro risk appetite has not. This cycle is divided according to the specific part of the market you are examining; it is neither universally back nor uniformly over.
The Shrinking Cycle Problem
Underneath all of this lies a longer pattern. Each of Bitcoin's bull cycles has produced lesser returns: around 22,700 percent in 2013, 9,879 percent in 2017, and 1,614 percent in 2021. So far, this cycle has produced about 571 percent off its bottom. Every cycle, someone asks, "Are we back?" with the expectation that the response will be 2017 or 2021. According to the honest pattern, each cycle appears slightly less explosive than the previous one, so "back" may just refer to something smaller than it used to rather than the cycle ceasing to function.
Where I Land On This
In reality, my response is that Bitcoin appears to be forming a floor rather than confirming a breakout, and the more precise picture has at least three distinct cohorts answering “are we back” differently, not two. Retail never waited for approval, as demonstrated by CASHCAT and Black Bull, whose degen risk appetite recovered in a matter of days when the appropriate narrative emerged. Whale wallets are buying with real conviction. 270,000 BTC in two weeks is not a small position, right into the same decline that ETF investors were escaping. In fact, the ETF-wrapped institutional money which is the capital that is meant to represent “institutions” in the majority of these discussions, just had its worst month on record.
More important than any headline figure is that split. Both "whales are buying aggressively" and "institutions are scared" are accurate at the same time, they simply refer to two distinct capital pools that are grouped together under one term. The stablecoin data adds a fourth wrinkle instead of solving anything. As established, the dry powder needed is present, and a significant portion of it appears to be completely exiting crypto rather than waiting to deploy into the next leg up.
So, are we back? Retail seems to have answered. Whales are silently responding with their size. ETF holders continue to respond negatively, and in record numbers. Whichever of those three groups turns out to be right first is probably the actual trade, not the meme.
Thursday Thesis drops every week. One topic, researched properly, with an actual take. If this was useful, subscribe on Substack so you never miss an issue. Don’t forget to drop me a follow on Twitter, @solr888. See you next Thursday.